What’s Driving Stocks, Bonds, and All-Time HighsAugust 19, 2026 | |||
The stock market has reached new all-time highs despite earlier uncertainty, which is good news for investors. Key sectors like Energy, Technology, and Industrials have helped drive this rally. Interest rates are also high, making bonds more appealing. However, investors should be ready for potential ups and downs, as we've seen in recent years. For those investing for the long term, it's important to balance portfolios with rising stock prices and higher yields. It might seem odd for stocks to soar while interest rates are high, but if both are performing well, it can help meet financial goals. How can investors navigate this high market environment? Stocks and bonds support portfolio balance, but in different ways
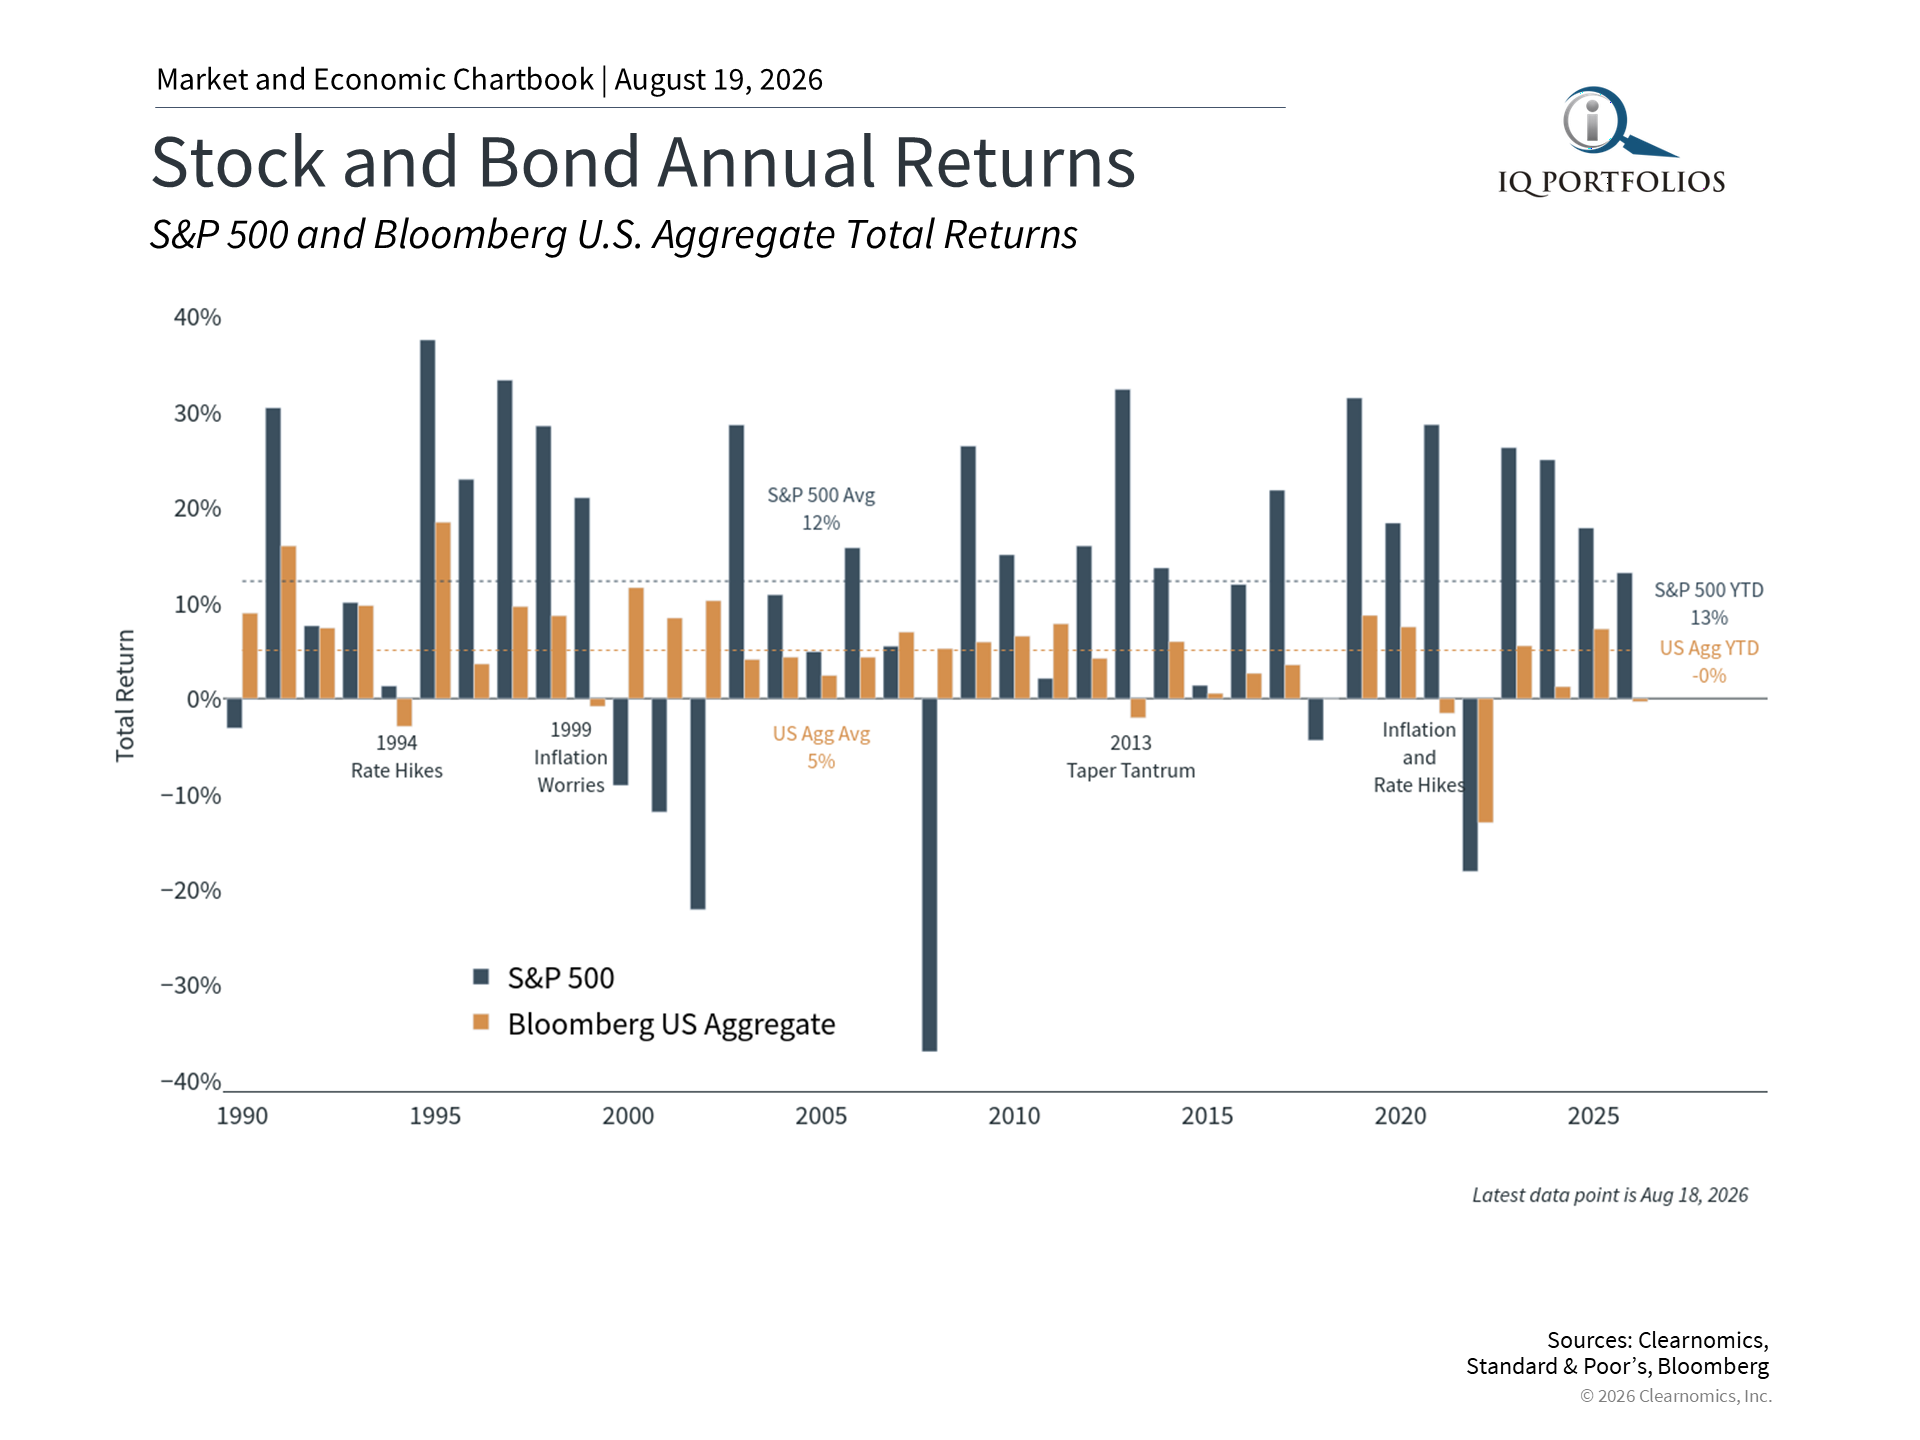
The S&P 500, Nasdaq, and Dow Jones have all enjoyed strong returns this year due to key factors. Artificial intelligence is boosting technology stocks, and higher oil prices are benefiting the energy sector, contributing to new market highs. A major reason behind this rally is the rapid growth in corporate earnings. For instance, the S&P 500's earnings per share could hit $347 this year, showing over 30% growth, far above the average. The Federal Reserve's actions on interest rates also play a crucial role. When rates go up due to inflation fears, it can weaken both stocks and bonds. However, if rates rise due to better economic growth, it can actually help boost stock prices. Overall, while interest rates are currently high, stocks have continued to rise. The takeaway for investors is to maintain a well-rounded portfolio that can benefit from different market conditions rather than trying to predict what will happen next. Waiting for pullbacks is often counterproductive
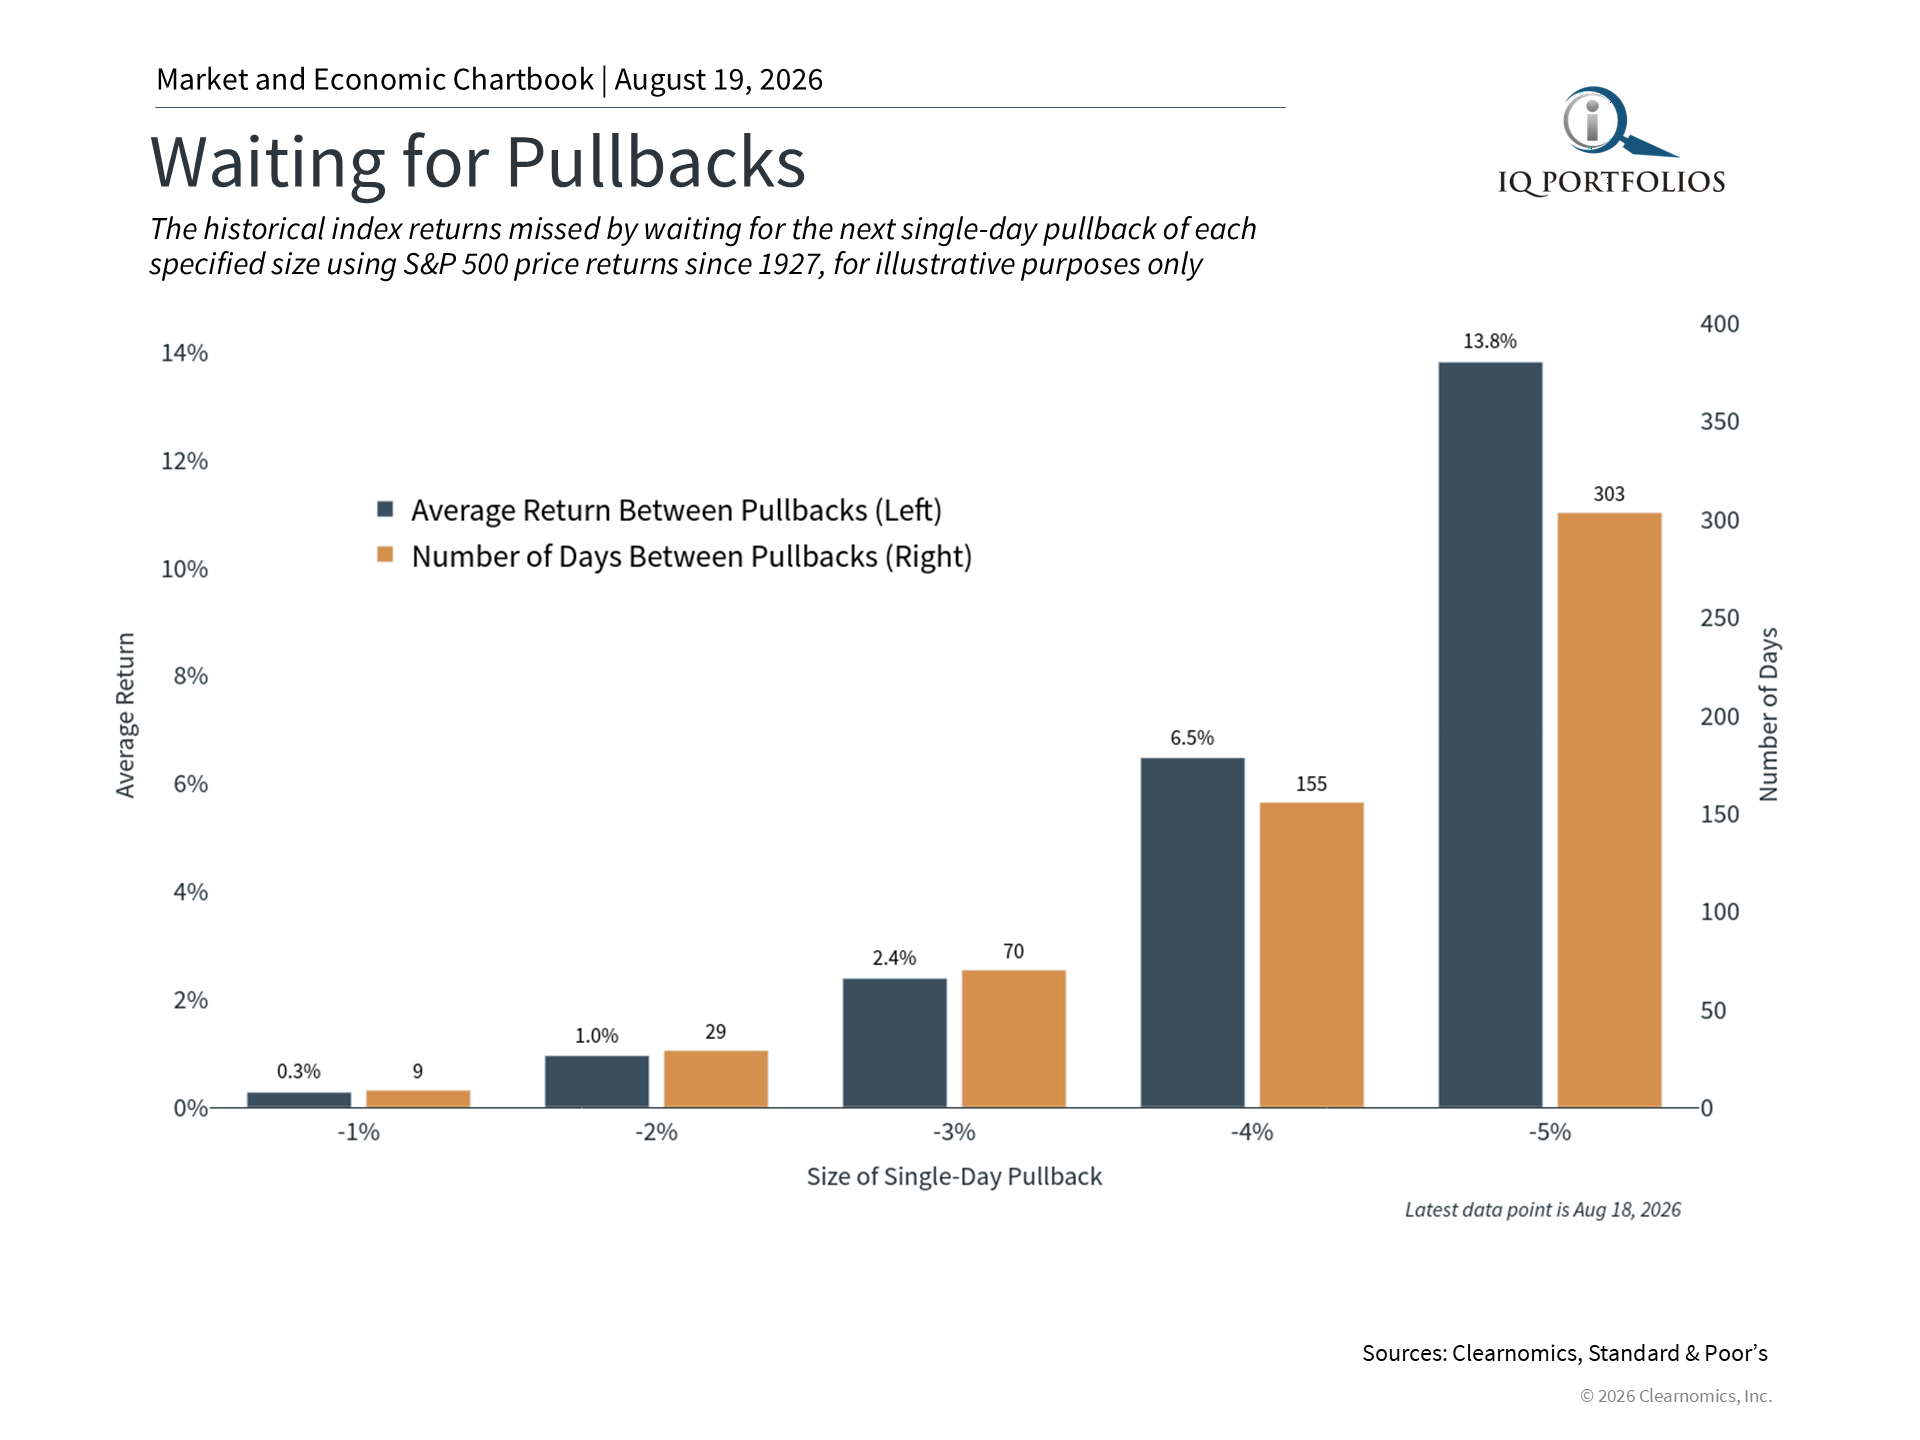
With markets at near all-time highs, many investors wonder if they should change their portfolios or wait to invest. History shows that trying to time the market can be unwise. Often, waiting leads to missed opportunities since markets usually rise over time. For instance, if someone waits for a 5% dip before investing, they might end up waiting a long time—averaging 291 days—while the market gains nearly 14%. Pullbacks do happen, but they are part of a normal market cycle, and staying invested is usually a better strategy for long-term success. If you need to invest a lump sum now, consider dollar-cost averaging, which involves spreading out your investments over time. Additionally, balancing your portfolio across different sectors and regions can help minimize risk while still allowing for growth potential. Bond yields drive long-term fixed income returns
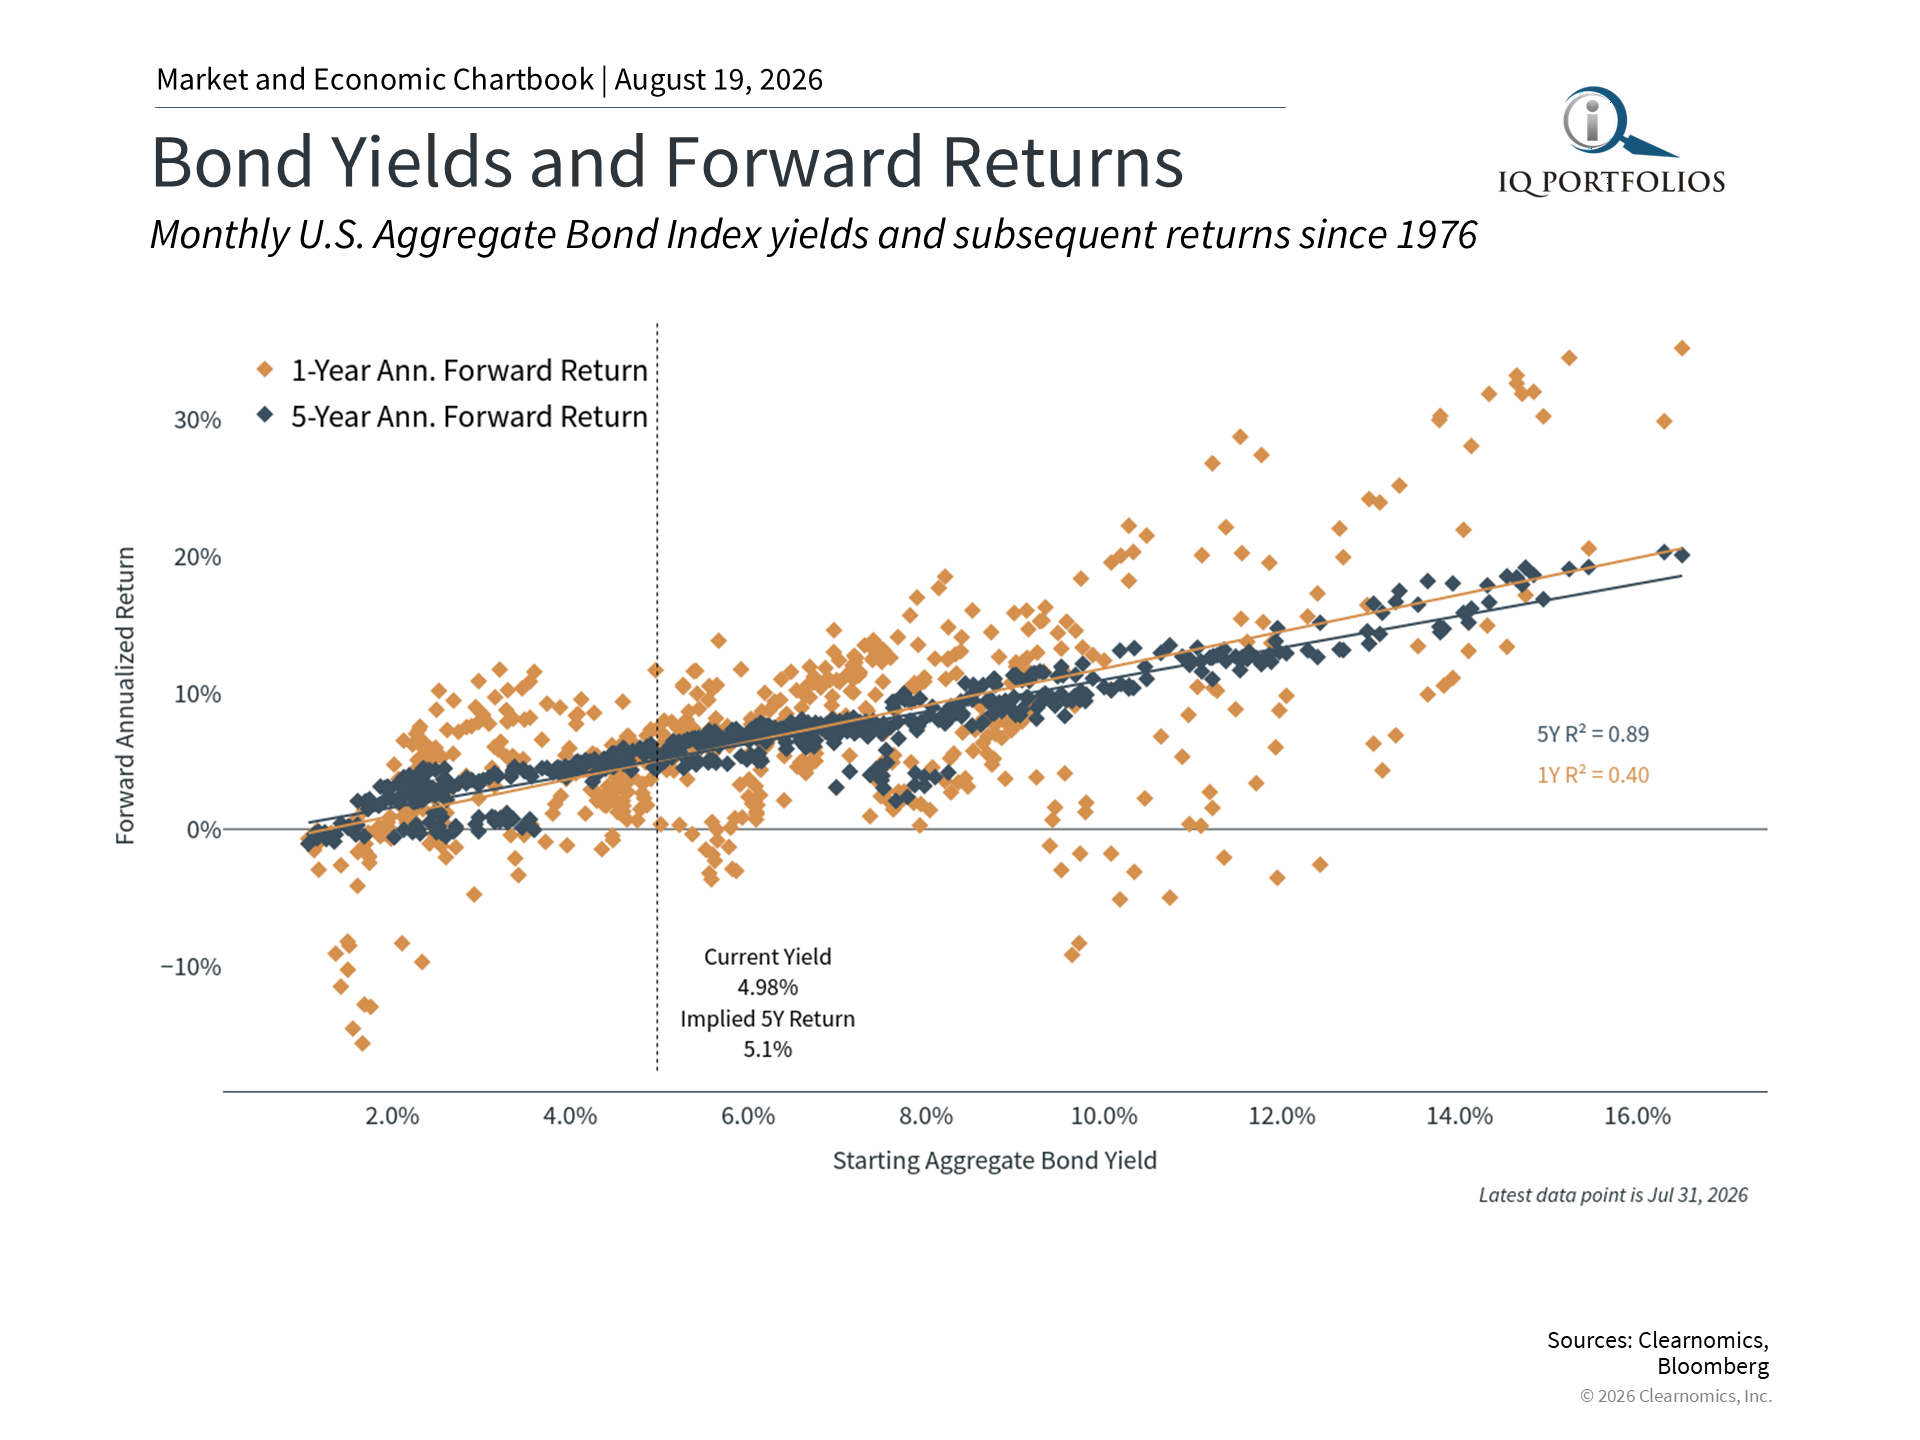
The stock market has done well this year, but bond prices are flat because interest rates are rising. Higher rates make existing bonds less valuable, but they also allow investors to get better yields when they buy new bonds. Right now, bond yields are the best they’ve been in two decades, making them an attractive option for income and balancing risk in a portfolio. In summary, while rising rates can hurt bond prices, they also create good opportunities for investors. Stocks are doing well, and with better bond yields, it’s a good time to keep a balanced portfolio focused on long-term financial goals. The bottom line? Stocks have benefited from growth trends while bond yields are historically attractive, creating opportunities across both asset classes. For long-term investors, maintaining a balanced portfolio is the best way to benefit from this environment while staying focused on financial goals. References 1. Standard & Poor’s and Nasdaq as of August 14, 2026 2. Clearnomics research using Standard & Poor’s and LSEG data, as of August 14, 2026 3. https://home.treasury.gov/resource-center/data-chart-center/interest-rates 4. Clearnomics research and Bloomberg data, as of August 14, 2026 Index Descriptions S&P 500 The Standard & Poor’s 500 Index is a capitalization-weighted index of 500 stocks designed to measure performance of the broad domestic economy through changes in the aggregate market value of 500 stocks representing all major industries. Dow Jones The Dow Jones Industrial Average consists of 30 stocks that are major factors in their industries and widely held by individuals and institutional investors. NASDAQ The NASDAQ Composite Index measures all NASDAQ domestic and non-U.S. based common stocks listed on The NASDAQ Stock Market. The market value, the last sale price multiplied by total shares outstanding, is calculated throughout the trading day, and is related to the total value of the Index. Bloomberg US Aggregate Bond Index The Bloomberg U.S. Aggregate Bond Index is an index of the U.S. investment-grade fixed-rate bond market, including both government and corporate bonds. | |||
DISCLOSURES: Copyright (c) 2026 Clearnomics, Inc. All rights reserved. The information contained herein has been obtained from sources believed to be reliable, but is not necessarily complete and its accuracy cannot be guaranteed. No representation or warranty, express or implied, is made as to the fairness, accuracy, completeness, or correctness of the information and opinions contained herein. The views and the other information provided are subject to change without notice. All reports posted on or via www.clearnomics.com or any affiliated websites, applications, or services are issued without regard to the specific investment objectives, financial situation, or particular needs of any specific recipient and are not to be construed as a solicitation or an offer to buy or sell any securities or related financial instruments. Past performance is not necessarily a guide to future results. Company fundamentals and earnings may be mentioned occasionally, but should not be construed as a recommendation to buy, sell, or hold the company's stock. Predictions, forecasts, and estimates for any and all markets should not be construed as recommendations to buy, sell, or hold any security--including mutual funds, futures contracts, and exchange traded funds, or any similar instruments. The text, images, and other materials contained or displayed in this report are proprietary to Clearnomics, Inc. and constitute valuable intellectual property. All unauthorized reproduction or other use of material from Clearnomics, Inc. shall be deemed willful infringement(s) of this copyright and other proprietary and intellectual property rights, including but not limited to, rights of privacy. Clearnomics, Inc. expressly reserves all rights in connection with its intellectual property, including without limitation the right to block the transfer of its products and services and/or to track usage thereof, through electronic tracking technology, and all other lawful means, now known or hereafter devised. Clearnomics, Inc. reserves the right, without further notice, to pursue to the fullest extent allowed by the law any and all criminal and civil remedies for the violation of its rights.  |
What is Driving Stocks, Bonds, and All-Time Highs - 2026.08.19
 |
August 19, 2026
|
August 19, 2026